Research on Sentiment Analysis Task for Mexican Tourist Texts (Rest-Mex)
The Rest-Mex task (webpage) presented at IberLEF 2023 focused sentiment analysis and clustering on tourist texts; nonetheless, our participation was only on the sentiment analysis tasks. The first task consisted of identifying the polarity of the tourist text. The second task was to identify whether the visited place was either an attraction, hotel, or restaurant. The third and last task was identifying the country (i.e., Colombia, Cuba, and Mexico).
The following table presents the performance, in terms of macro-\(f_1\), for the different systems tested for the polarity task. The performance was estimated using a cross-validation approach, the training set \(\mathcal T\) was split into a training (80%) and validation set (20%) of the original dataset.
It can be observed that the best configuration corresponds to a Stack Generalization using two BoW systems as its base classifier. It is statistically equivalent to Stacking Generalization using three BoW.
The following code can generate an instance of the system used in the competition.
>>> from EvoMSA.competitions import Comp2023
>>> comp2023 = Comp2023(lang='es')
>>> ins = comp2023.stack_bows()
Configuration |
Performance |
p-value |
|---|---|---|
|
0.5605 |
1.0000 |
|
0.5603 |
0.4140 |
|
0.5472 |
0.0000 |
|
0.5467 |
0.0000 |
|
0.5448 |
0.0000 |
|
0.5446 |
0.0000 |
|
0.5431 |
0.0000 |
|
0.5420 |
0.0000 |
|
0.5346 |
0.0000 |
|
0.5310 |
0.0000 |
|
0.5179 |
0.0000 |
|
0.5167 |
0.0000 |
|
0.5152 |
0.0000 |
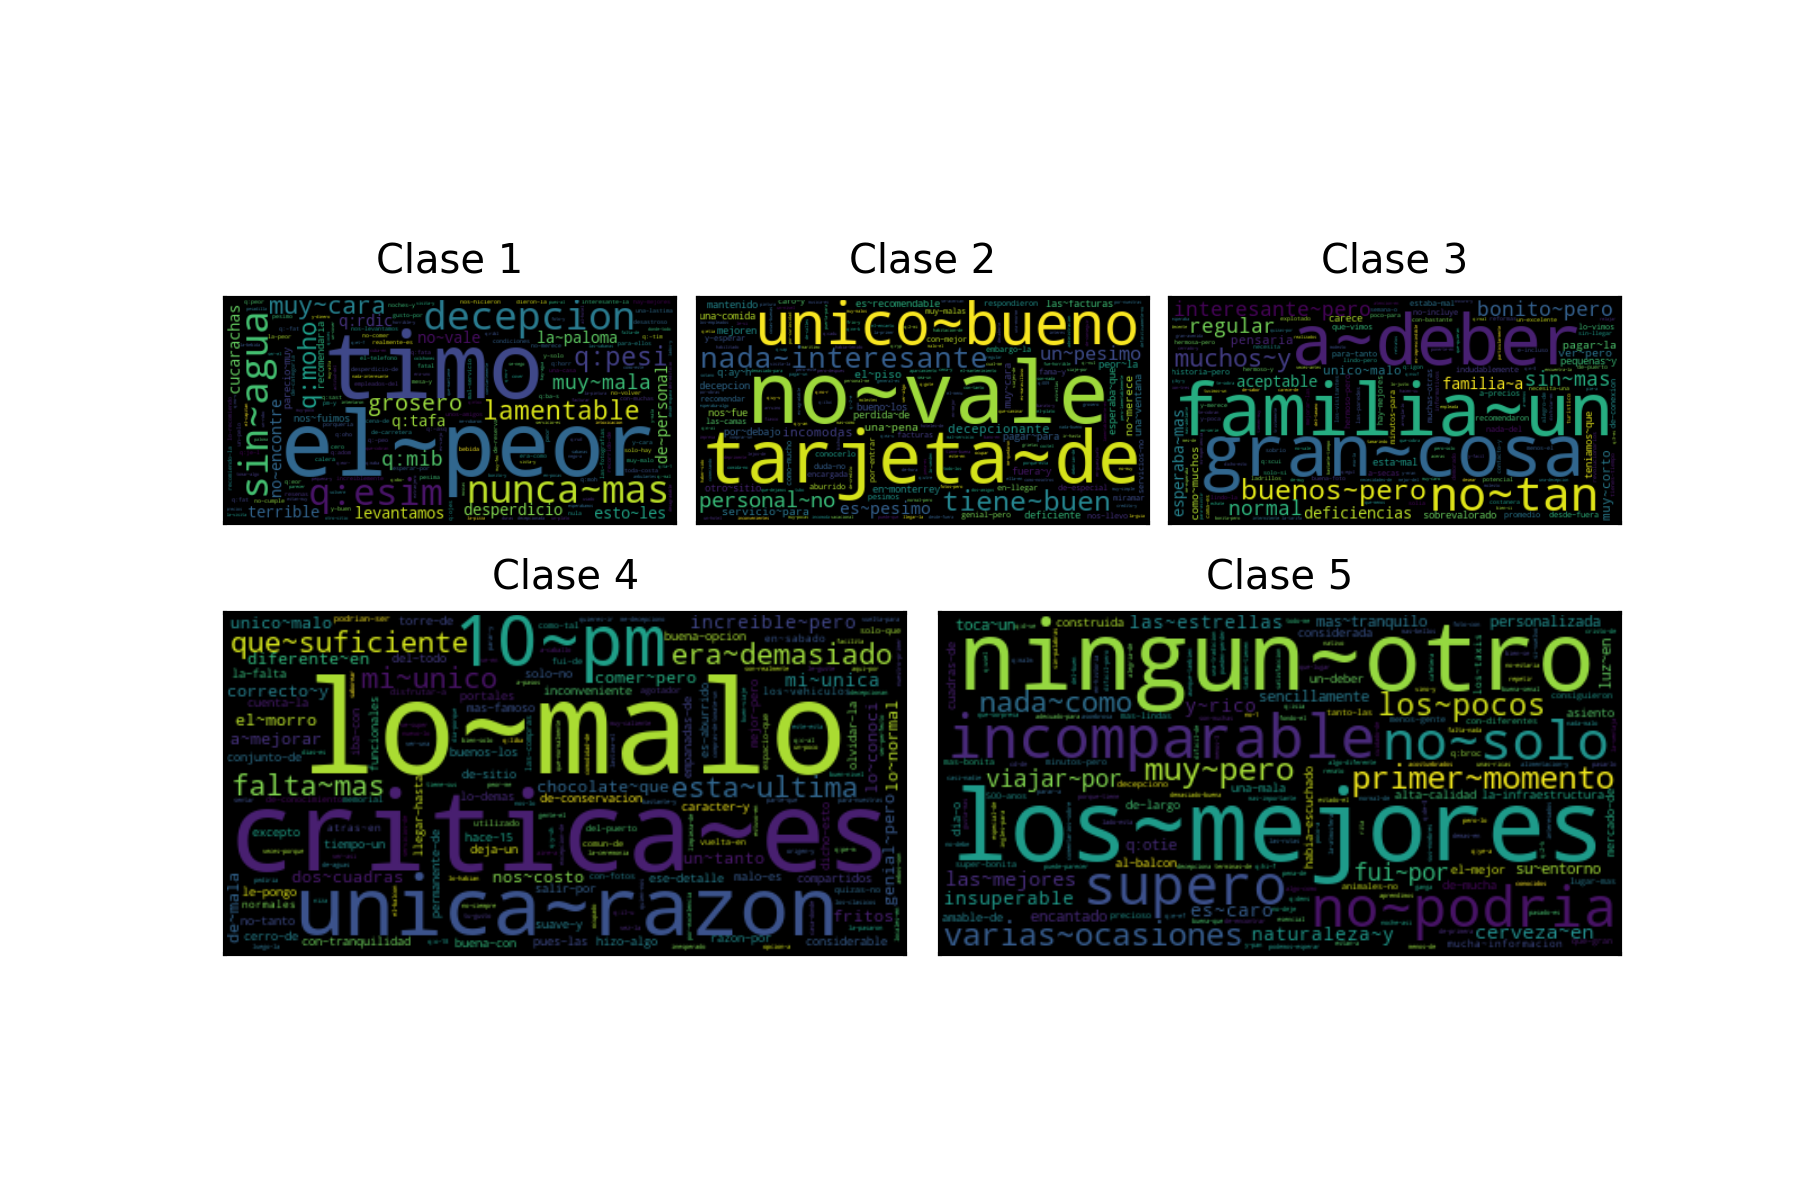
The following figure presents a word cloud with the most discriminative tokens for each class in the polarity task. The word clouds were generated for the BoW system with default parameters; the other BoW system has a similar word cloud where the difference is in the tail of the distribution which is not reflected on the cloud.
The following table presents the performance, in terms of macro-\(f_1\), for the different systems tested for the type task. The performance was estimated using a cross-validation approach, the training set \(\mathcal T\) was split into a training (80%) and validation set (20%) of the original dataset.
It can be observed that the best configuration corresponds to a BoW system trained on the training set. The following code can generate an instance of the system used in the competition.
>>> from EvoMSA.competitions import Comp2023
>>> comp2023 = Comp2023(lang='es')
>>> ins = comp2023.bow_training_set()
Configuration |
Performance |
p-value |
|---|---|---|
|
0.9802 |
1.0000 |
|
0.9793 |
0.0040 |
|
0.9793 |
0.0000 |
|
0.9792 |
0.0000 |
|
0.9783 |
0.0000 |
|
0.9783 |
0.0000 |
|
0.9782 |
0.0000 |
|
0.9773 |
0.0000 |
|
0.9773 |
0.0000 |
|
0.9769 |
0.0000 |
|
0.9768 |
0.0000 |
|
0.9743 |
0.0000 |
|
0.9742 |
0.0000 |
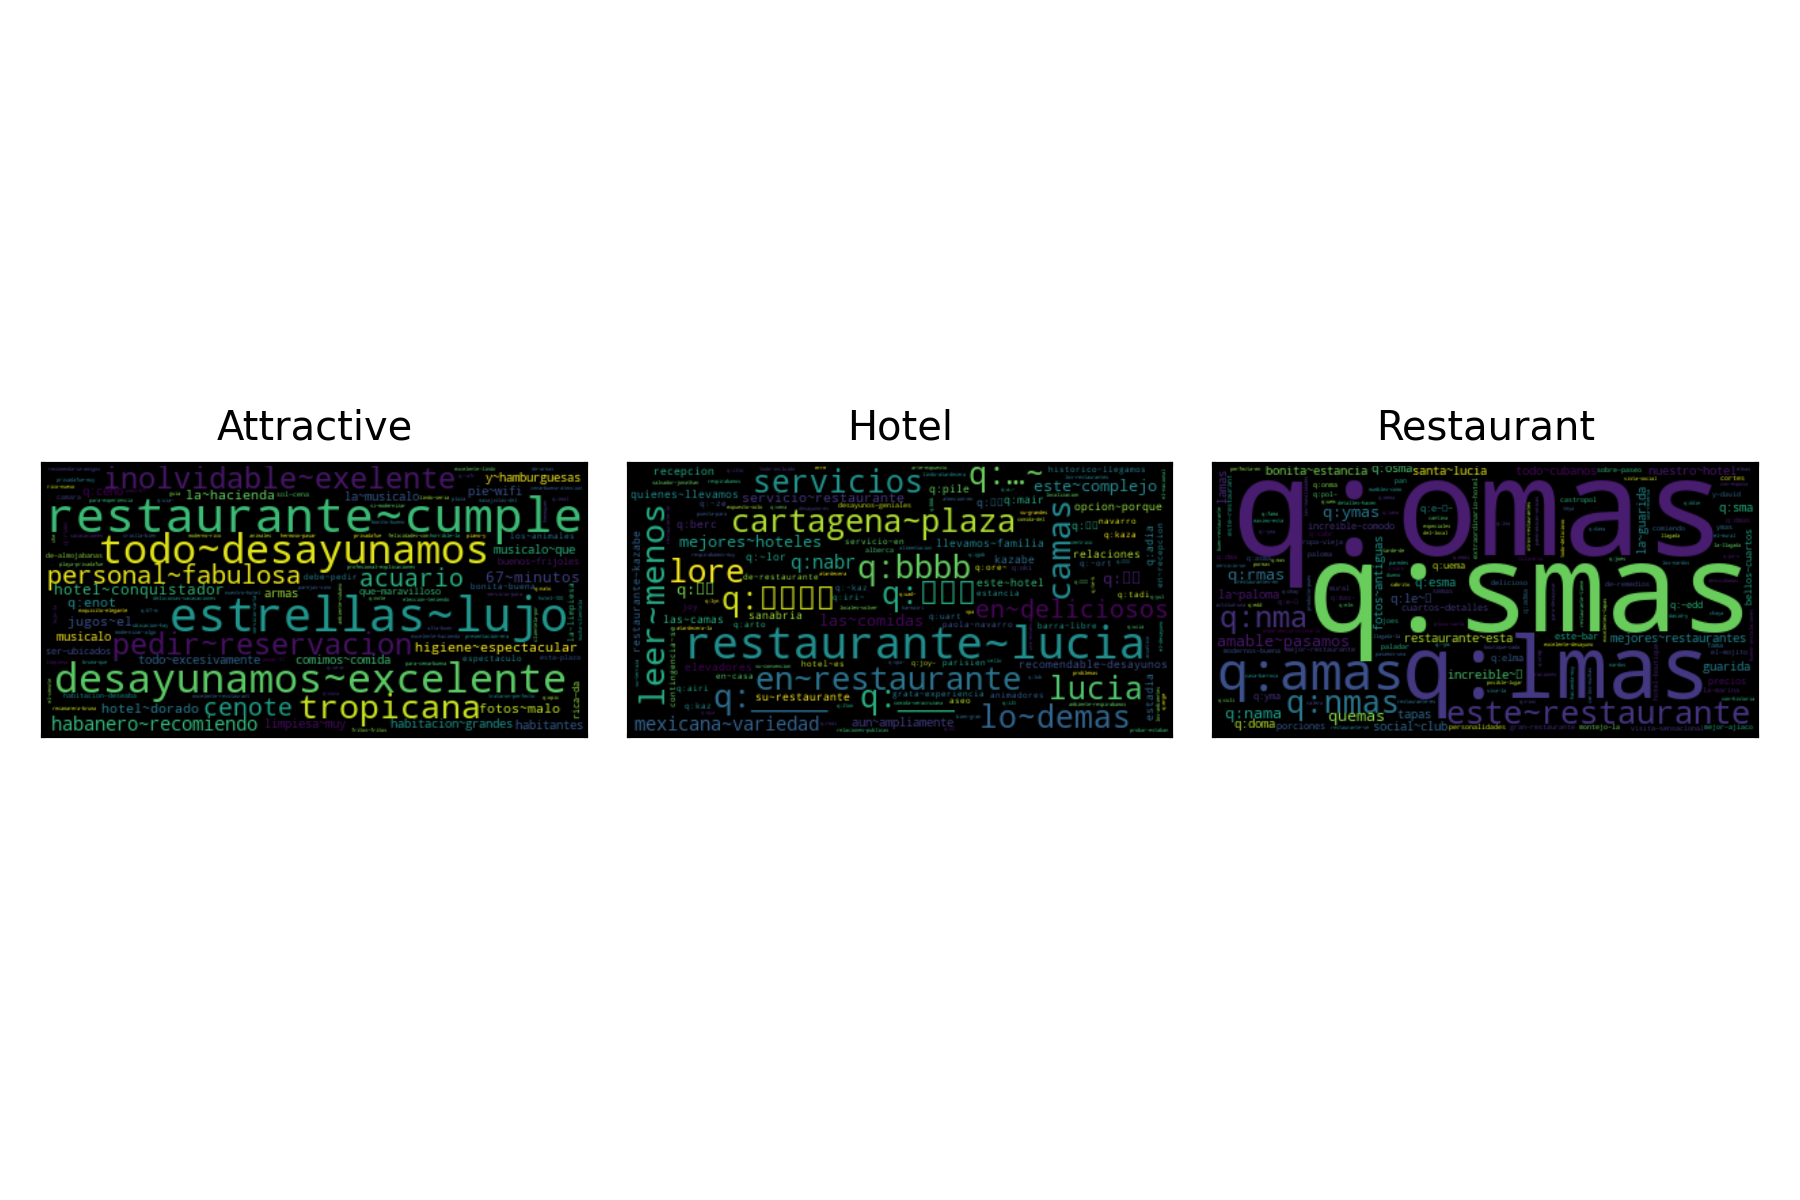
The following figure presents a word cloud with the most discriminative tokens for each class in the type task.
The following table presents the performance, in terms of macro-\(f_1\), for the different systems tested for the type task. The performance was estimated using a cross-validation approach, the training set \(\mathcal T\) was split into a training (80%) and validation set (20%) of the original dataset.
It can be observed that the best configuration corresponds to a BoW system trained on the training set. The following code can generate an instance of the system used in the competition.
>>> from EvoMSA.competitions import Comp2023
>>> comp2023 = Comp2023(lang='es')
>>> ins = comp2023.bow_training_set()
Configuration |
Performance |
p-value |
|---|---|---|
|
0.9260 |
1.0000 |
|
0.9225 |
0.0000 |
|
0.9200 |
0.0000 |
|
0.9194 |
0.0000 |
|
0.9167 |
0.0000 |
|
0.9166 |
0.0000 |
|
0.9164 |
0.0000 |
|
0.9101 |
0.0000 |
|
0.9097 |
0.0000 |
|
0.9076 |
0.0000 |
|
0.9076 |
0.0000 |
|
0.8951 |
0.0000 |
|
0.8949 |
0.0000 |
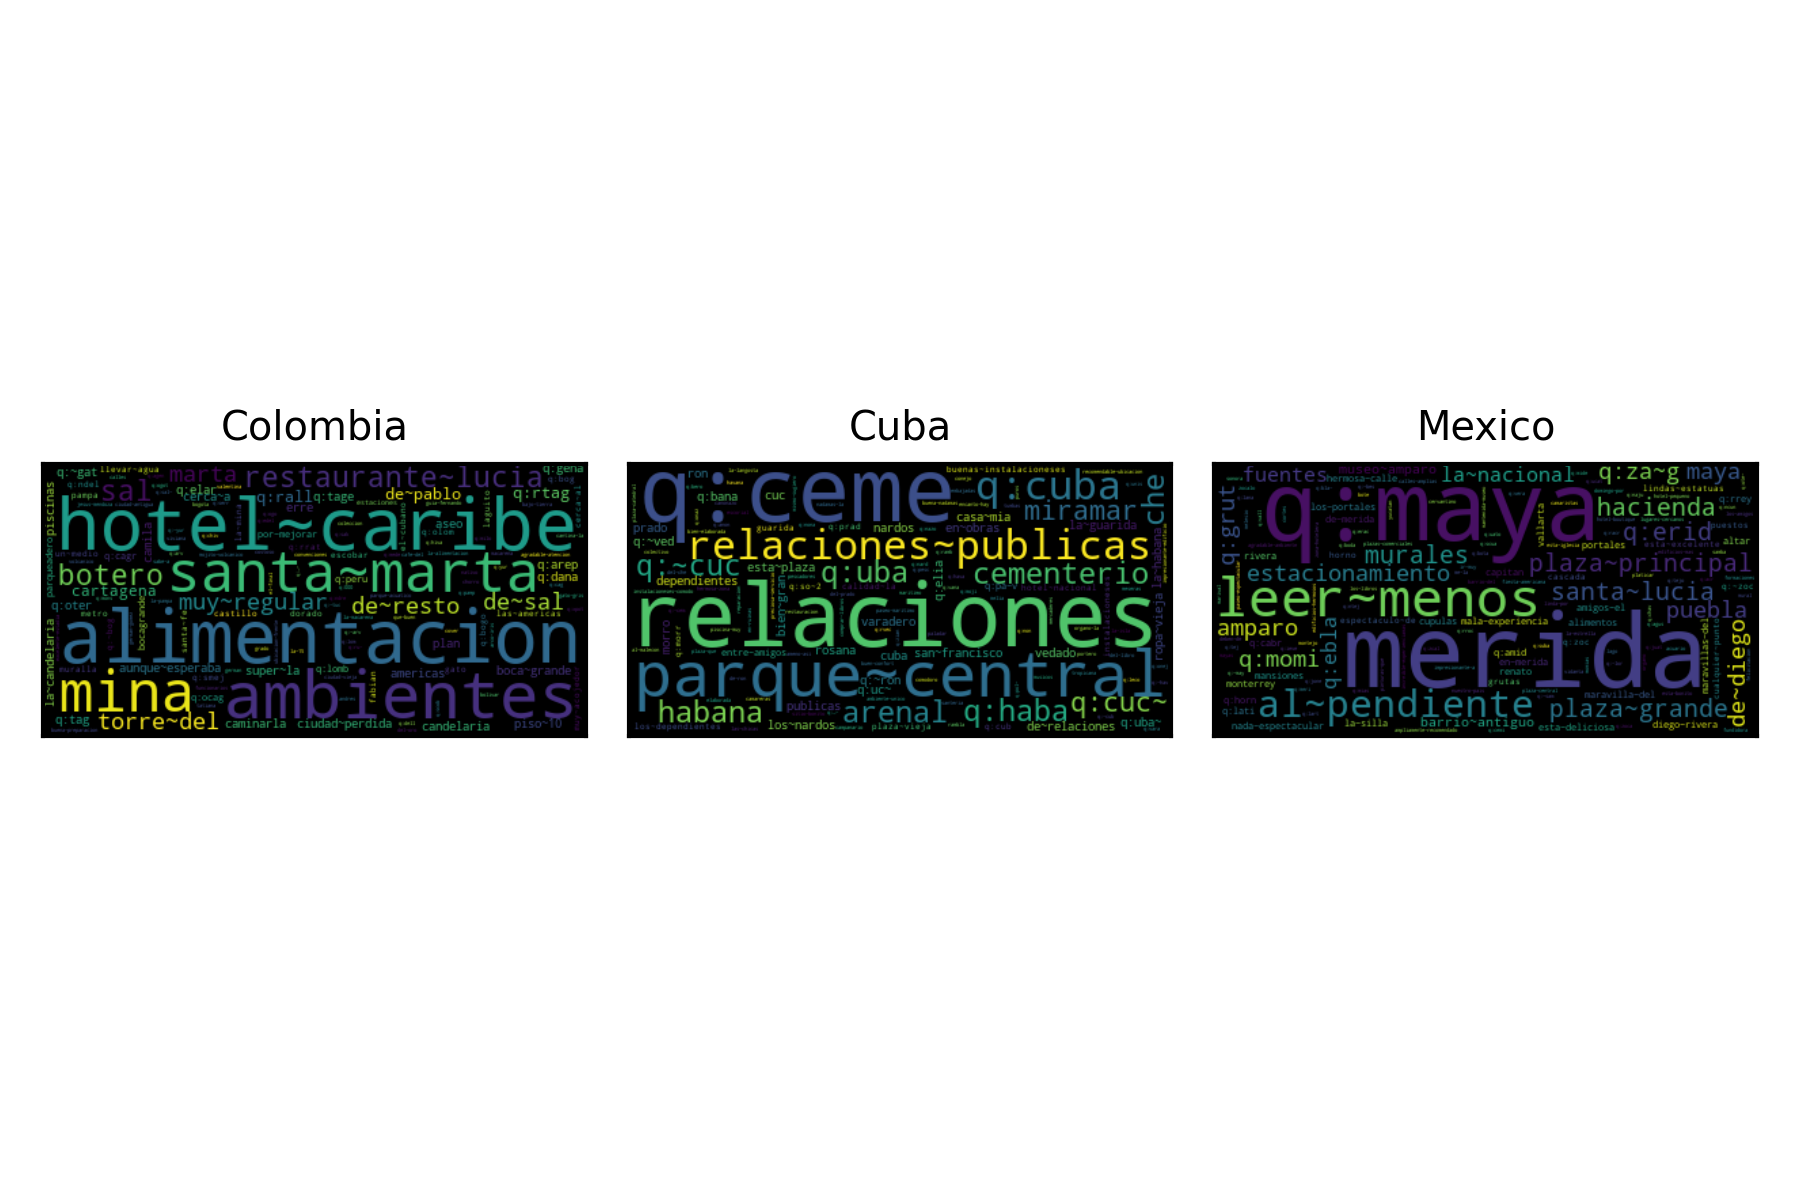
The following figure presents a word cloud with the most discriminative tokens for each class in the country task.